According to Donald Knuth
We should forget about small efficiencies, say about 97% of the time: premature optimization is the root of all evil
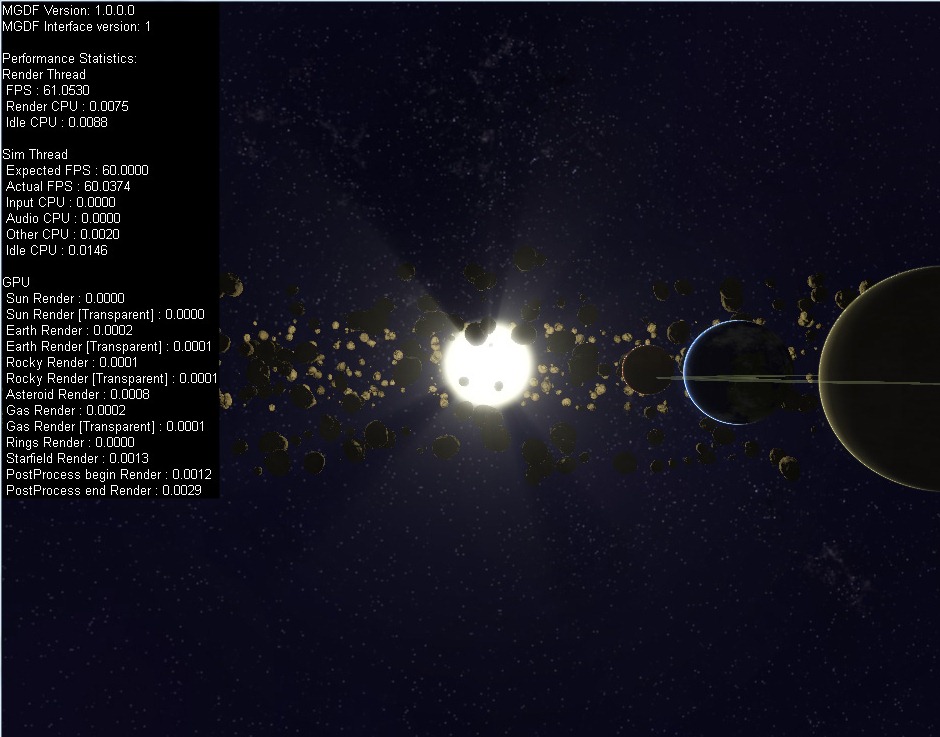
Now this seems like sage wisdom, and its wisdom I agree with, however in practice I’ve found that if you begin a project without thinking at all about the performance considerations of your design decisions, you’ll come to regret it later. After you get annoyed at how slow things are, you’ll decide to do some optimizin’ and you get a couple of low hanging fruit out of the way but then quickly find that there are no more hot-spots left, but the program still performs horribly because of numerous small architectural problems. So how does one reconcile getting the important things done and not getting bogged down by excessive optimization, but also ensure that your program isn’t carrying the weight of accumulated poor decisions?
Now I’m not going to claim any silver bullets here – but for me the key is to build in good instrumentation and profiling information early on, so that the performance impact of each new feature is immediately apparent. This ensures that you can control bloat as it appears, but also means that you can plow on ahead with new features if the profiling shows no performance red flags. Now profiling CPU time is a relatively trivial thing, you can use the QueryPerformanceFrequency (warning this blog post is going to be windows and DirectX centric) function to get the frequency of the high resolution timer, then take timing samples using QueryPerformanceCounter, and finally divide the sample differences by the frequency and voila! accurate profiling information!
Unfortunately though in this day and age, most games are GPU - rather than CPU - bound and the previous timing method will not give you any useful information as to what’s eating your GPU’s cycles. The reason for this is that the GPU runs in parallel to the CPU, (usually a frame or two behind the CPU) so most DirectX API calls are largely non-blocking on the CPU side of things; they just queue up commands which the GPU will execute later. This means that if you sample the CPU time before and after Direct3D API calls, all you are measuring is the direct CPU cost of the call, not the time that the GPU will use executing those commands at some point in the future.
Luckily DirectX does have a means of measuring the time taken on the GPU side of things, but due to the asynchronous nature of the GPU, it can be a bit tricky to work with. In DirectX 9 (Dx10 & 11 are largely the same) it’s a 3 step process, firstly we create some Query objects, we then issue the queries either side of the API calls we want to profile, then at some point in the future we ask for the result of those queries when they become available. The last part is the trickiest, as we don’t want to stall the CPU waiting for the GPU to give us the result of our queries, we want to buffer the responses so that we’ll only try to get the results after we’re pretty sure that they are ready (i.e. a few frames in the future). This does mean that the profiling information for the GPU is going to lag behind by a few frames, but in practice this isn’t a big issue. The important bits of code are as follows
//determine if the queries we need for timing are supported

HRESULT tsHr = device->CreateQuery(D3DQUERYTYPE_TIMESTAMP, NULL);
HRESULT tsdHr = device->CreateQuery(D3DQUERYTYPE_TIMESTAMPDISJOINT, NULL);
HRESULT tsfHr = device->CreateQuery(D3DQUERYTYPE_TIMESTAMPFREQ, NULL);
if (tsHr || tsdHr || tsfHr)
{
    //oh no, the timing queries we wan't aren't supported BAIL OUT!

}

//The disjoint query is used to notify whether the frequency

//changed during the sampling interval. If this is the case

//Then we'll have to throw out our measurements for that interval

IDirect3DQuery9* disjointQuery;
device->CreateQuery(D3DQUERYTYPE_TIMESTAMPDISJOINT, &disjointQuery);

//This query will get us the tick frequency of the GPU, we will use

//this to convert our timing samples into seconds.

IDirect3DQuery9* frequencyQuery;
device->CreateQuery(D3DQUERYTYPE_TIMESTAMPFREQ, &frequencyQuery);

//these two queries will record the beginning and end times of our

//sampling interval


IDirect3DQuery9* t1Query;

device->CreateQuery(D3DQUERYTYPE_TIMESTAMP, &t1Query);

IDirect3DQuery9* t2Query;
device->CreateQuery(D3DQUERYTYPE_TIMESTAMP, &t2Query);

...

//before we start rendering

disjointQuery->Issue(D3DISSUE_BEGIN);
frequencyQuery->Issue(D3DISSUE_END);
t1->Issue(D3DISSUE_END);

//RENDER THE FRAME

t2->Issue(D3DISSUE_END);
disjointQuery->Issue(D3DISSUE_END);

...

//a few frames later, lets try and get the result of the query

BOOL disjoint;
if (disjointQuery->GetData(&disjoint,sizeof(BOOL),0) == S_OK)
{
    //if the timing interval was not disjoint then the measurements

    //are valid

    if (!disjoint)
    {
        UINT64 frequency;
        if (frequencyQuery->GetData(&frequency,sizeof(UINT64),0) == S_OK)
        {
            UINT64 timeStampBegin;
            if (t1->GetData(&timeStampBegin,sizeof(UINT64),0) != S_OK)
            {
                return;//not ready yet

            }

            UINT64 timeStampEnd;
            if (t2->GetData(&timeStampEnd,sizeof(UINT64),0) != S_OK)
            {
                return;//not ready yet

            }

            UINT64 diff = timeStampEnd - timeStampBegin;
            //The final timing value in seconds.

            double value = ((double)diff/frequency);
        }
    }
}
Another important point to note is that these query objects MUST be released whenever the D3D device is lost/reset. I haven’t included code for doing this or ensuring that the commands are buffered correctly, however if you want a complete working example check out the Timer class in the MGDF framework that powers junkship.